 Earlier this summer the Arkansas Department of Health released its annual report regarding abortion.
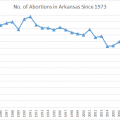
The report shows, among other things, that abortion has fallen to its lowest levels since 1977 and that fewer women are coming to Arkansas from other states to have abortions.
It also shows that abortion among teenagers has fallen to new lows.
In 1994 some 6,036 abortions were performed in Arkansas. Of those, 1,503 were on teenagers — nearly one in every four abortions.
In 2016 only 349 abortions were on teenagers — less than 11% of all the abortions performed in Arkansas that year.
Some say this decline is due to increased access to birth control among teenagers. However, Arkansas’ teen pregnancy rates have remained high. While that’s nothing to brag about, it shows contraceptives are not the reason teenagers are having fewer abortions.
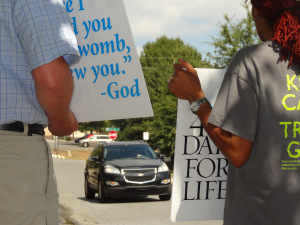
What’s behind the drastic decline in abortion? For one thing, we are building a culture of life. Abortion is unthinkable to many young people who have seen ultrasound images and know what abortion really is.
I also believe much of the credit goes to our pro-life laws passed in recent years. In 2015 Arkansas passed one of the best informed-consent laws in the nation. It ensures women are given all the facts about abortion up front. Nearly 500 women chose not to have abortions last year after being given that information.
Below is a breakdown of abortion among teenagers and adults in Arkansas since 1994.
| Year | Teen | Non-Teen / Unknown | Total |
| 1994 | 1,503 (24.9%) | 4,533 (75.1%) | 6,036 |
| 1995 | 1,435 (24.4%) | 4,451 (75.6%) | 5,886 |
| 1996 | 1,479 (24.3%) | 4,603 (75.7%) | 6,082 |
| 1997 | 1,378 (23.4%) | 4,511 (76.6%) | 5,889 |
| 1998 | 1,334 (21.4%) | 4,891 (78.6%) | 6,225 |
| 1999 | 1,157 (20.7%) | 4,435 (79.3%) | 5,592 |
| 2000 | 1,158 (21.3%) | 4,291 (78.7%) | 5,449 |
| 2001 | 1,184 (20.1%) | 4,715 (79.9%) | 5,899 |
| 2002 | 1,006 (19%) | 4,282 (81%) | 5,288 |
| 2003 | 1,015 (18.8%) | 4,384 (81.2%) | 5,399 |
| 2004 | 884 (19.1%) | 3,756 (80.9%) | 4,640 |
| 2006 | 956 (19.2%) | 4,029 (80.8%) | 4,985 |
| 2007 | 870 (18%) | 3,972 (82%) | 4,842 |
| 2008 | 866 (18.1%) | 3,916 (81.9%) | 4,782 |
| 2009 | 774 (16.9%) | 3,799 (83.1%) | 4,573 |
| 2010 | 750 (16.6%) | 3,778 (83.4%) | 4,528 |
| 2011 | 615 (15.3%) | 3,417 (84.7%) | 4,032 |
| 2012 | 535 (14.1%) | 3,247 (85.9%) | 3,782 |
| 2013 | 451 (12.1%) | 3,281 (87.9%) | 3,732 |
| 2014 | 486 (11.4%) | 3,786 (88.6%) | 4,272 |
| 2015 | 407 (10.8%) | 3,364 (89.2%) | 3,771 |
| 2016 | 349 (10.9%) | 2,858 (89.1%) | 3,207 |
| Total | 20,243 (19.2%) | 85,441 (80.8%) | 105,684 |